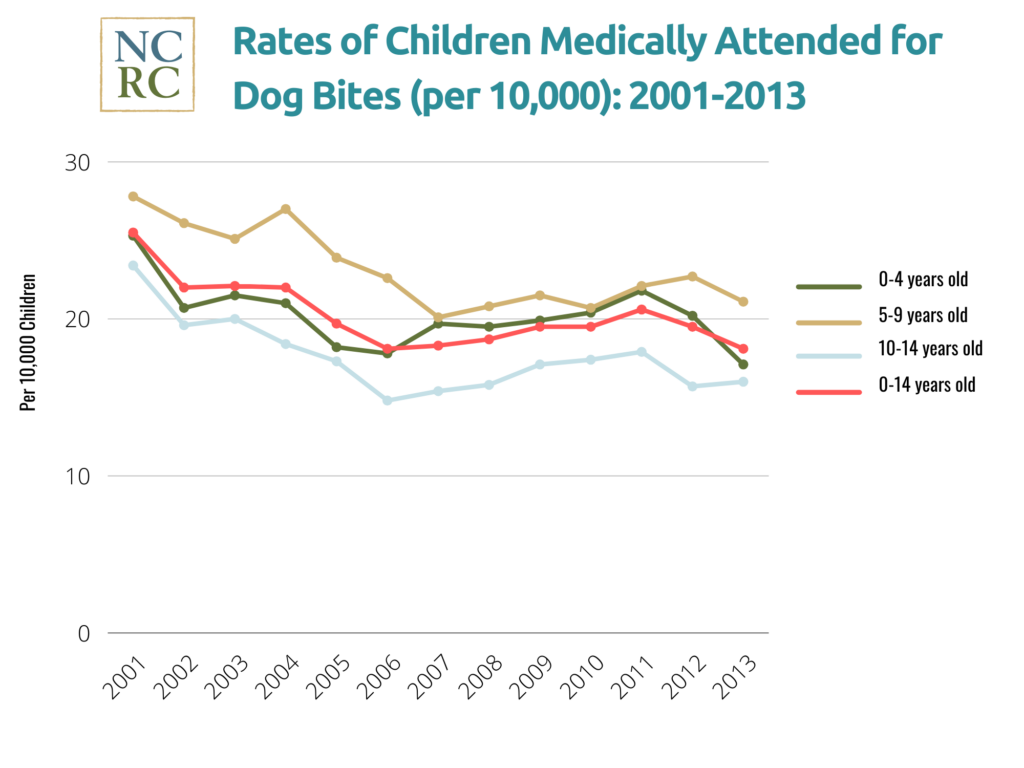
To produce comparisons such as those above, and graphics such as the chart on rates of bites to children, we use the Center for Disease Control’s Web-based Injury Statistics Query and Reporting System (WISQARS)[8] for dog bites and other injury modalities and the Consumer Product Safety Commission[9] for product related injuries, both of which use the National Electronic Injury Surveillance System (NEISS). This provides the most reliable data because NEISS:
Collects large samples, gathering data from a nationally representative sample of 100 hospital emergency departments, ranging from large inner-city hospitals with trauma centers to suburban, rural, and children’s hospitals
- Is based on actual emergency room intake data
- Provides clear indicators of injury treatment severity
- Have been consistently replicated each year over a long period
- Allow for ready access to comparisons by year, age group, gender, and kind of injuries
- Limitation—NEISS captures injuries treated in hospital emergency departments, not private doctor’s offices or urgent care clinics
We do refer to the most frequently cited studies[10] but only as a source of overall bite incidence, including those that cause no injury. We do not use them as our primary source of bite severity or injurious bite incidence because they:
- Are based on small sample telephone surveys asking people to remember events over a year’s time
- Had low respondent rates and wide margins of error
- Are one time surveys that quickly become dated and are seldom replicated
- Provide only vague distinctions between injurious and non-injurious bites and vague definitions of injury
Updated February 1, 2016