In an attempt to predict which dog owners are likely to be involved in a dog bite liability claim, Massachusetts enacted mandatory reporting by insurance companies in 2019. The information gathered, however, does not meet any standard of valid risk analysis. Risk analysis requires comparing two sets of data. Only one is present here. This itself renders the data presented useless. Even if both sets were present, the survey questions used leave so much open to interpretation, are so unverifiable, and contain such large percentages of “unknown” responses, that they could never be used in a proper risk analysis. After two years of claims reporting, the information simply does not exist here to make any sort of prediction.
The purpose of this summary is to encourage the Insurance Industry to use scientifically valid methods of data collection and risk analysis. To do any less results in biased and unproductive policies.
Included at the end of this analysis are the spreadsheets with collected information from 2019 and 2020.
First difficulty – These spreadsheets cannot fuel a risk factor analysis, and thus can provide no information about the potential for claim reduction. A risk factor is something that increases risk. This means it is something more likely to be present in individuals who suffer some harm (like getting sued for a dog bite) than in ones who don’t. By definition, a risk factor is a comparison. In this case, the comparison would be between insured dog owners whose insurers have paid out claims as a result of their dog having bitten someone and insureds who have dogs but have no such claims against them1. But, the data collected in Massachusetts only provides the first half of that comparison. As an example, the Massachusetts dog bite insurance claims data includes a field for whether or not the dog involved in an incident had “gone through obedience training.” The combined data from 2019 and 2020 showed that roughly 29% of the dogs had, roughly 40% had not, and for the remaining 31%, this information was “unknown.” If we put that data into a pie chart it would look like figure 1 here:
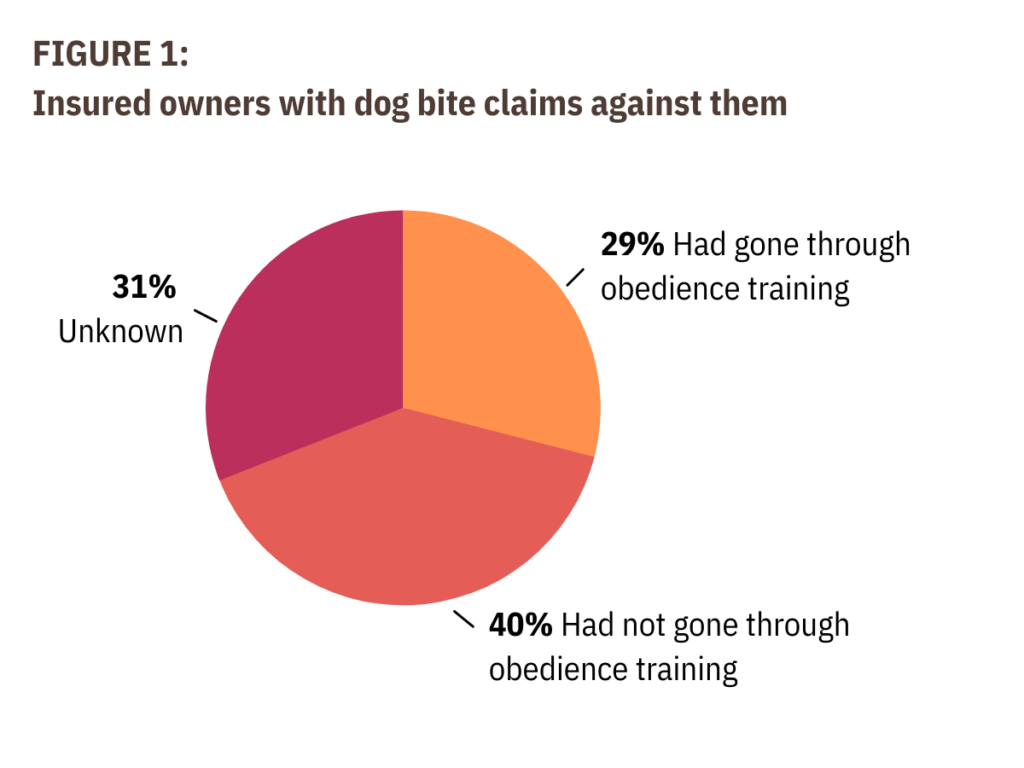
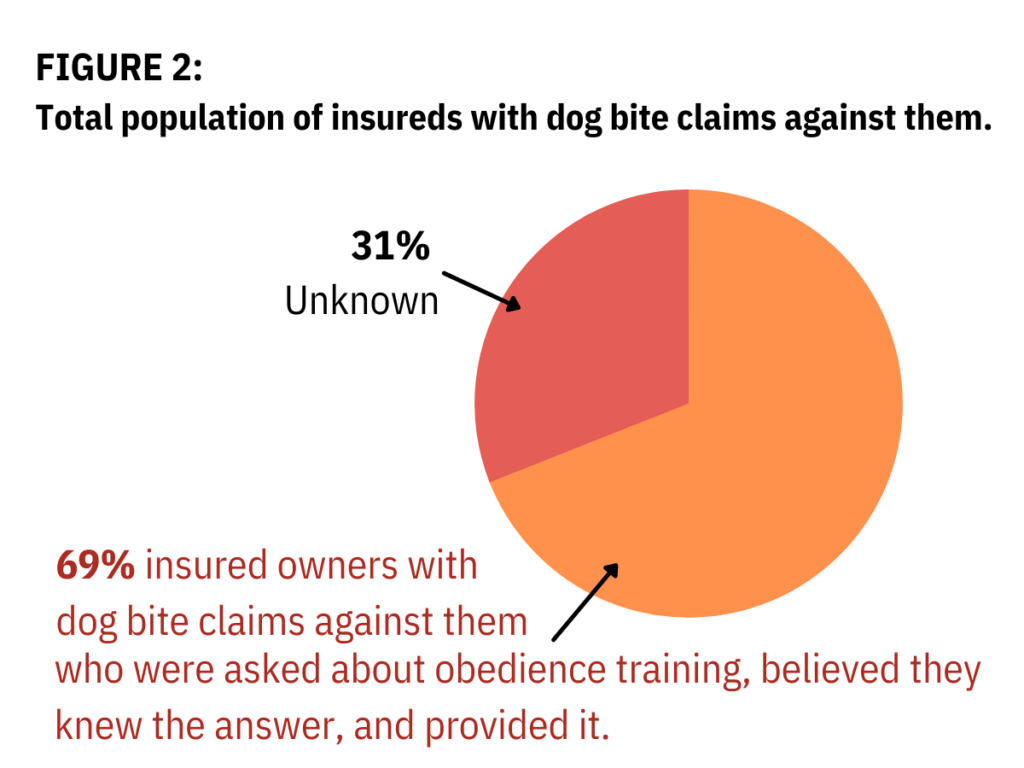
Based on this, one might conclude that the lack of obedience training was a risk factor for dog bite claims, causing insurers to payout. However, it would be completely erroneous to draw this conclusion based solely on this data. For 31% of these claims, we can’t say whether or not their dogs had obedience training. These people perhaps weren’t asked, didn’t answer the question, or didn’t know whether their pets had training. To be more clear, because a third of our sample presents no information, the only conclusions we could draw are speculative ones. We could speculate either way, but that’s all it would be, speculation. So Figure 2 above shows the information that we actually have.
These “unknown” responses are equally problematic for other factors. On the question of whether the dog was spayed or neutered, more than 1 in 4 (26% total) came back as “unknown.” This means that even if a control were identified and surveyed, a comparison between the two groups would have much too great of a margin for error and wouldn’t be useful.
But this is the least of our problems. Here’s the fatal issue. We must have the same data from the general population group (in this case, insureds with dogs who have not had dog bite claims against them). In order to calculate risk, and thus potential losses, we must be able to compare insured dog owners with claims against them with insured dog owners without dog bite claims. And we have no information whatsoever about the latter. If we were to be able to collect data on insureds with no claims against them, 3 hypothetical risk scenarios are possible and equally plausible. One possibility is Scenario 1 below.
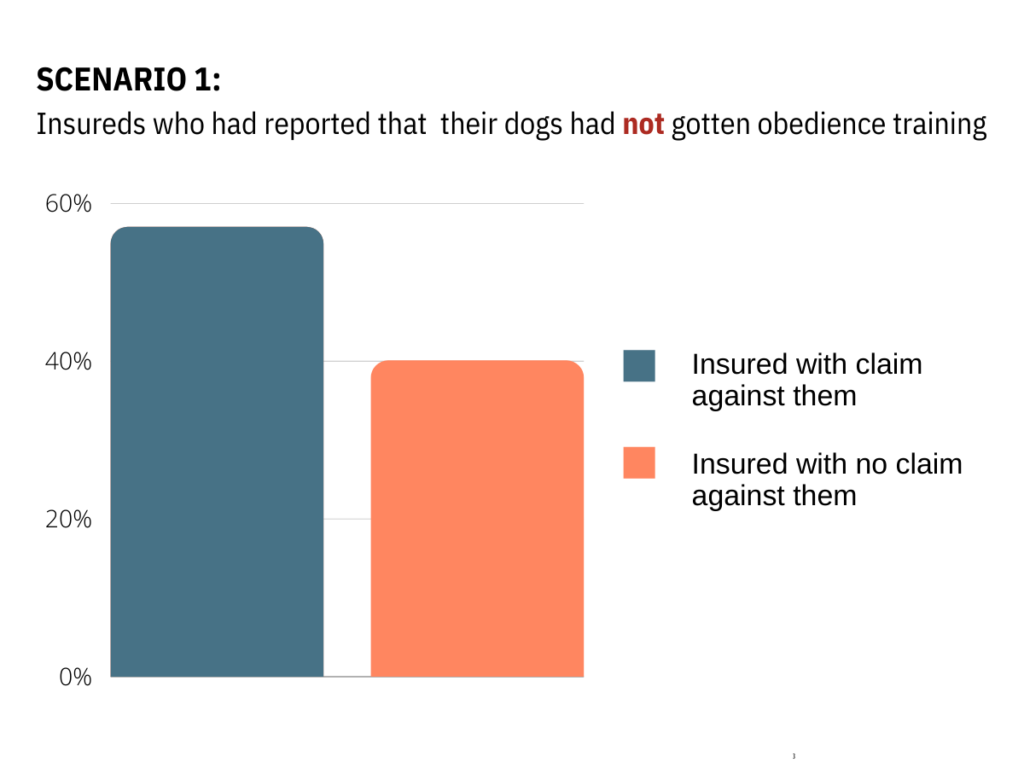
If for example, fewer than 57% (let’s say 40%) of the insureds with no claims against them had not put their dogs through obedience training, and the percentage of those reporting as unknown was miraculously the same in the no-claims group, then this may be a modest risk factor.
Scenario 2 below shows another equally plausible scenario. If close to 57% of the no claims clients had done obedience training, like those with claims whose dogs had gone through training, then there is no risk factor.
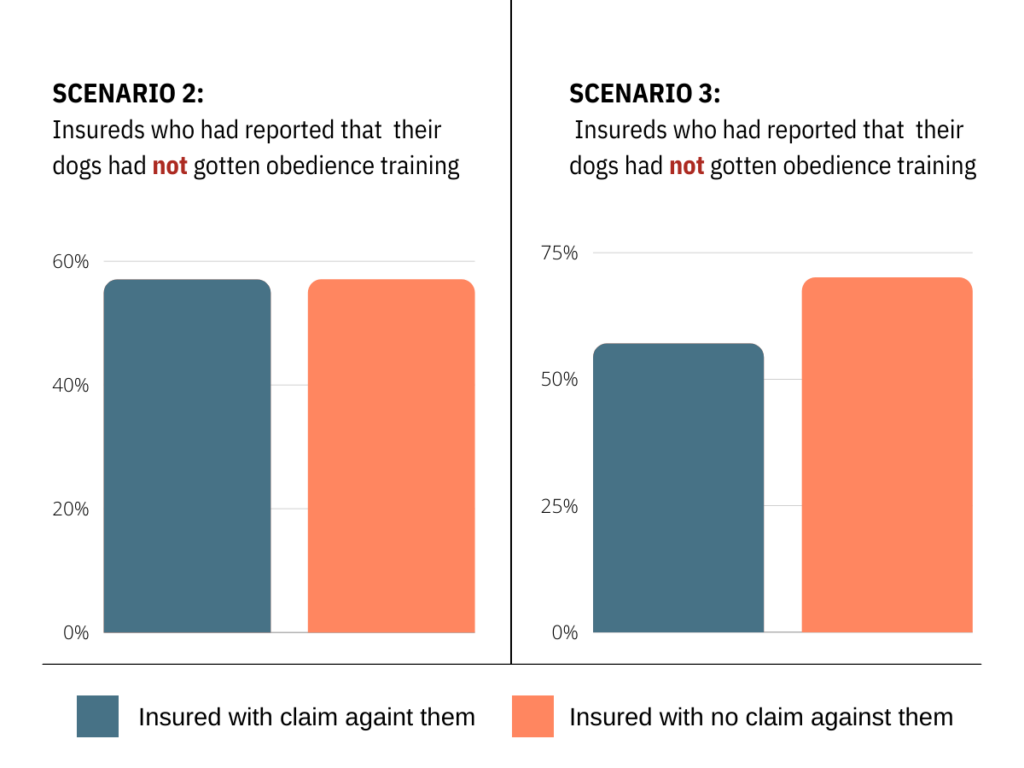
If, as in Scenario 3 above, more of the clients without claims, say 70%, had not put their dogs through training, then this choice might actually have a protective effect. 2
Without the comparison between the 2 groups, the odds of making the right choice based on this one-sided data set are much worse than, say flipping a coin—two out of three equally likely outcomes is worse than the status quo.
The same is true for all the other factors for which data were collected. (And this doesn’t take into account the loss of the “unknowns” in any factor that is included in this category. Because the number of unknowns is substantial, it carries the possibility of completely changing the data totals, and consequently fatally compromising the credibility of the group being studied.
Second difficulty – Sampling issues obstacles to identifying a control group. So let’s say that the industry does perform a genuine risk analysis for dog bite claims. This involves collecting comparative data from randomly selected insured people with dogs without dog bite claims against them. This group needs to be of similar size to the study sample with the caveat that there is a high participation rate.
This process is very technical and not easy to accomplish. There are lots of variables that confound both the existing sample and any control sample. Remember, this is a very narrow subset of dog bite incidents, which means that any risks that might be identified in the general academic dog bite literature could not be applied here. First, these are all, by definition, reported dog bites. Many factors go into whether or not a dog bite victim reports the incident. Beyond that, reporting can take many forms, from seeking medical attention to filing police or animal control reports. Only a small subset of reported incidents result in lawsuits against the dog owner. Moreover, the sample of interest here will almost never concern someone who lives with the dog, further narrowing an already narrow subset of incidents.
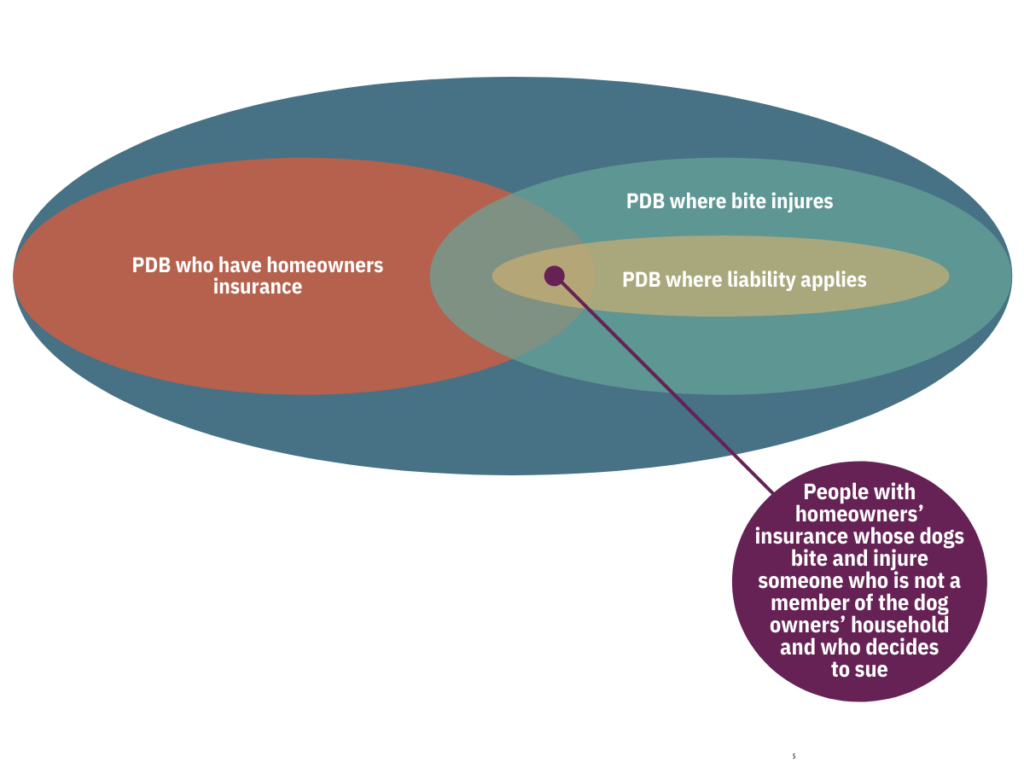
The graphic below may help clarify just how narrow and specific a sample size we are talking about. This narrow size explains why even if we had widely academically accepted findings regarding the factors relevant to the likelihood of biting behavior, we still couldn’t have confidence that any policy based on this small number would reduce lawsuits.
The blue oval represents dog owners whose dogs bite someone. But most dogs’ bites do not cause injury. The aqua oval inside the blue (much larger here than its actual proportion for legibility) contains those whose dogs bite and injure. But not all owners of dogs who bite have liability insurance, so the red oval represents those insured owners. But liability only comes into play when the victim and dog are not members of the same household. That’s the yellow section. So we are left with only those incidents where all these groups overlap, the small purple dot in the middle. a very small proportion of those people whose dogs bite someone. The possibility of identifying factors which separate this group from all the larger categories, beyond the common sense basics of responsible pet ownership, is unlikely in the extreme.
Third difficulty – Exposure issues. Even if a credible control sample was possible, there would still be problems.
Items M through X on the datasheet of the existing sample are specific to a particular bite incident, so they cannot be replicated with a non-biting sample.
It is of no help to make substitutions like “how often is your dog off of your property?” with a control group because we do not have this information for the dogs in the bite incidents.
This factor is generally referred to as “exposure,” and is crucial to medical risk analysis. There is no way to extract it from this data.
And it bears repeating that even a bonafide risk factor is not the same thing as a cause. This is often traceable to a failure to consider exposure. One well-publicized example is higher car insurance premiums for families with teenage boys than with teenage girls. This decades-old discrimination was recently debunked when someone decided to look at how much time boys spent behind the wheel, relative to girls and revealed that boys simply drove more than girls, not that they were more dangerous drivers. The real factor was time behind the wheel and if they zeroed in on this much more precise variable, they could set criteria to reduce payouts.
General notes on the data – The procedural difficulties described above render the use of this data impractical. But let’s assume that we can establish an appropriate control group. In that unlikely event, we still have problems because the data itself presents difficulties in verifying accuracy and defining factors.
As mentioned earlier, factors M through X concern specific circumstances of the bite incident with no contextual reference to the amount of exposure, leaving us with nothing to compare within a control group. If, for example, most of the incidents occurred when dogs were off-leash (factor Q), we would still need to know whether the biting dogs spent more time off-leash than the non-biting dogs. But let’s say we also discover that a very high percentage of bites occur off-leash and that most of these also occur while the dog is off of its owner’s property. We still have at least 2 problems.
One is the one we keep repeating: we don’t know how much time the biting dogs spend off-leash off the owners’ property compared with the non-biting dogs. The other is our sample bias, which is going to capture more bites in this context than we would if we included in-home events. Off property, bites are more likely to have non-household members as victims, which is the direction in which liability claim bites already skew, telling us only what we already knew. These same confounds disqualify this entire group of proposed factors, which center around the specific circumstances of the incidents.
So we’re left with factors E through L to consider as data that might go into a risk analysis calculation. K and L, the 2 factors regarding whether the dog had ever been declared dangerous by any local authority, are in effect
empty categories, populated by a tiny fraction of a percent, so can provide no data regarding risk, even if we had a control group. We can eliminate them without any further examination of the variety of behaviors and circumstances that might result in such a designation.
This leaves us with 6 factors to consider with regard to the credibility of the data.
First difficulty – data quality. Factor J asks whether the dog has ever been through a behavior evaluation. Let’s discuss why this question doesn’t help us with risk analysis. It does not ask about the results of the evaluation, just whether or not there had been one. Is the presumption that simply having a behavior evaluation done is evidence of a dangerous dog? This is essentially a guilty until proven innocent approach. Plus, the percentage of reported evaluations is tiny (over 90% of responses were no or unknown).
Perhaps the intended use of this information was to make an argument for widespread use of behavior evaluations, in the belief that this could identify dogs who were likely to injuriously bite. Unfortunately, there is simply no credible possibility that any behavior evaluation could identify such a group. There is robust literature that shows that no behavior evaluation meets reasonable standards of validity or reliability (the 2 primary metrics applied to diagnostic instruments) in predicting future behavior. Moreover, the prevalence of seriously injurious behavior toward humans is so low among dogs that even if such an evaluation existed, it’s statistically implausible that its predictions would be any better than flipping a coin.
In addition, no behavior evaluation currently in use attempts to predict whether a dog will at some time in the future bite a non-family member. The intention of behavior evaluations is varied and not very specific. For example, many simply attempt to predict whether a dog will express any warning signs that people might find objectionable. But, the tests designed to do this have consistently failed to achieve anything close to an acceptable level of success for diagnostic purposes.
And remember, only roughly 1.4% of dogs inflict a bite in which medical care is sought, that’s the highest estimate in the research literature. Most research puts it much lower, including the CDC’s research.
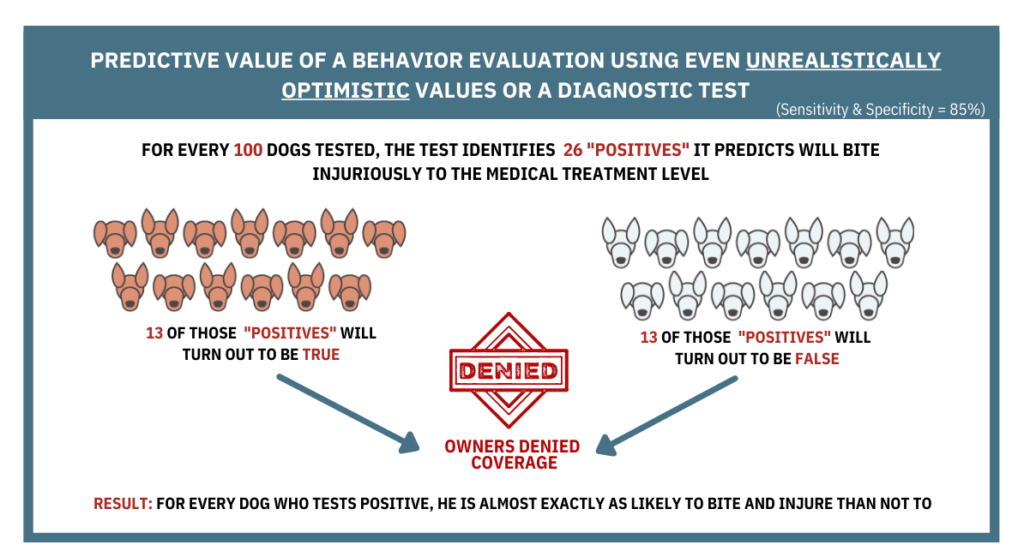
The accuracy of a diagnostic test is measured in terms of “sensitivity” (how well it identifies those positive for the condition of interest) and “specificity” (how well it identifies those who are negative). In the graphic on the next page, we are hypothesizing an implausibly high rating of 85% for both of these to the tens of millions of dogs owned by people who carry homeowners’ insurance. Even in this fantasy universe, the results with regard to an individual dog would be, literally, a toss-up. A positive score on the test would be just as likely to occur with a negative individual as the other way around. In reality, of course, since none of the conditions described above could possibly be met, the predictive validity would undoubtedly be much, much worse.
Factors F and G contain breed labels for the dogs involved in claims incidents and information about how those labels were assigned. In terms of data quality, these may be the most problematic of all the factors. There are at least 3 major issues that affect the accuracy of this data.
Use of the term, “predominant” to describe the breed label. This descriptor renders all the breed labels here unusable, with the exception of the ~25% who are presumably pedigreed dogs as their identification is attributed to “papers.3” The “predominant” term presents at least 3 problems.
First, and most simply, “predominant” implies that more than half (or at least more than any other breed) of the dog’s DNA can be traced to the named breed. This can only be established through DNA analysis (and sometimes not even then) or through direct knowledge of the precise, documented heritage of the parents. Without such documentation, the dog’s breed heritage is divided among 3 equally plausible possibilities: she is a pedigreed dog of a single breed for whom no pedigree was reported; she is a mix of an unknown number of breeds in unknown proportions of which the named breed is one; she is a mix of an unknown number of breeds in unknown proportions of which the named breed is not one. A dog’s physical traits actually provide no indication of the relative likelihood of these possibilities.
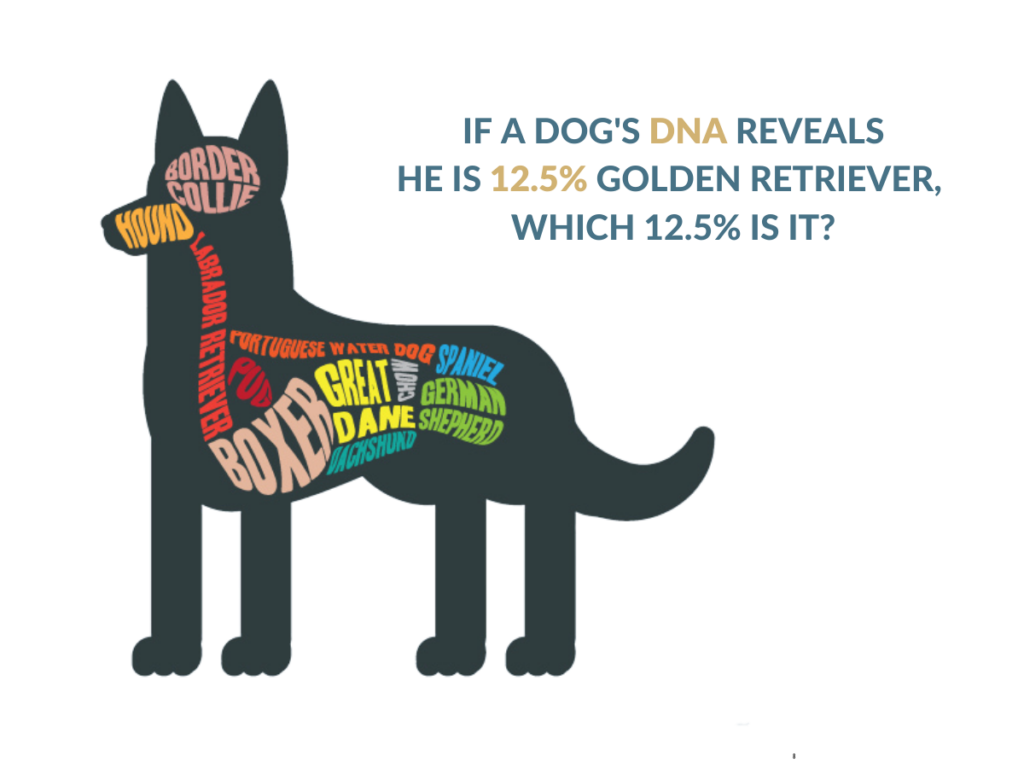
The second problem with the “predominant” label is that it can provide no information regarding which traits the dog has inherited from its ancestors. As soon as the closed gene pool is opened, even only to the extent of including 2 purebred parents of different breeds, the possible genetic combinations become dizzyingly vast. These 2 difficulties add up to an outcome that can be illustrated by the graphic here.
The third problem created by the term “predominant” is that it prevents any possibility of even speculating as to which of the dogs not identified by “papers” are purebred, rather than mixed breed dogs. We can’t even tell how many of those surveyed believe their dogs to be purebreds.
Unreliability of visual breed identification. Multiple scientific studies have found that even experienced dog professionals are much more likely to be wrong than right when they attempt to identify dogs’ breed ancestry simply by the dogs’ looks. This holds true whether the attempt is to name the “predominant” breed or even any of the combinations of breeds that appear in DNA analysis. This high error rate affects 75% of the data in this category because there is only a paper trail for 25% of the dogs.
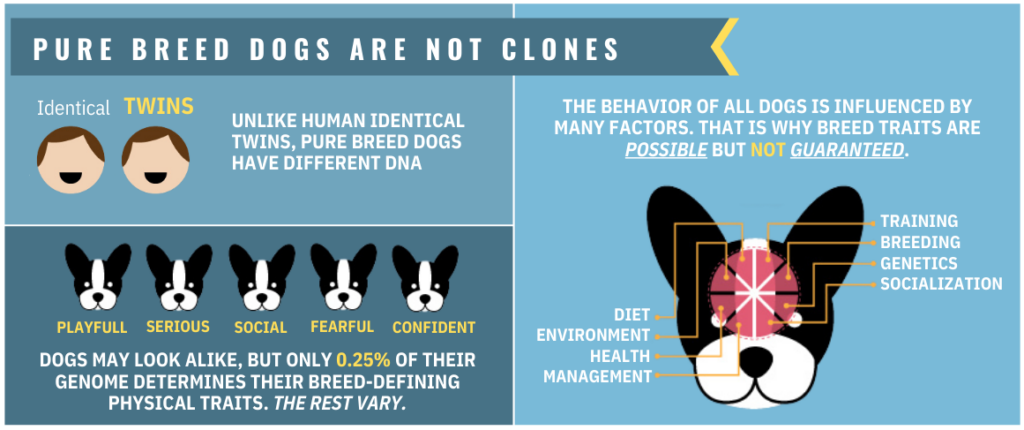
Behavioral genetics and purebred dogs. Even if one were to try to draw conclusions based only on the dogs reported to be purebreds, the effort would be statistically futile. A 25%, non-random proportion of a sample is simply inadequate when it comes to drawing a conclusion. The science of canine genetics is so young that conclusions about both the DNA and heritability aspects are still in flux, even on relatively simple morphological traits, like coat color. The one area of consensus among researchers in this field is that most if not all behavioral traits are probably polygenic, meaning they are expressed as a result of a very complex interaction of multiple and as yet unidentified alleles, and that their actual expression occurs in a complex interaction with a dog’s environmental context. No genetic behavioral breed traits have been isolated. What we do know, is that purebred dogs are not clones. The graphic here shows the relationship between physical appearance among purebred dogs and other traits.
Second difficulty: undefined factor descriptions
With the exception of factors F and G which concern breed identification and are discussed under the “First difficulty” above, factors O, R, and S present the greatest difficulties here.
In addition to the lack of exposure data which they share with the other incident-specific factors (M through X) and which prevent the possibility of comparisons with a hypothetical control group for actual risk factor analyses, several of these three factors suffer from the use of undefined and subjective terminology, which prevent knowing what is actually being measured.
Factor O: “How far was the dog from the victim prior to the incident?” While the data itself at first glance might appear concrete (consisting of either distance expressed in feet or “unknown”), this impression of specificity is misleading. We don’t know what is meant by “prior to the incident.” Did the incident begin when the dog’s teeth made contact with the victim? When she began to approach after presumably, having been directing her attention elsewhere? When (if) she began expressing threatening signals? Or at some other point in time?
The need for this sort of clarification is typically anticipated during the design of surveys. Interviewers are trained in a flow chart style progression of questions, the sequence of which is then recorded. This prevents people from misunderstanding the questions and thus skewing the survey results. But, in this case, we don’t know how the questions were asked. We don’t know what the margin of error is for how the respondents interpreted the questions. Moreover, we don’t know if any of this data was collected from third-party reports. To put it simply, without defined queries, we can’t know what any of this means.
Factor R: “Was the dog provoked before injury occurred?” Again, we run into the problem of an undefined query. What was the intended meaning of the term “provoked” and how was it interpreted by the respondents? The term itself suggests the subject is being asked to make a judgment about whether the victim’s behavior motivated the dog to bite and whether the bite was justifiable on the dog’s part. The second part of this judgment requires unknowable access to the dog’s internal state of mind and processing of his environment and we simply cannot answer that. It might be possible to set criteria for “provocation,” but none of that is defined within this dataset.
Factor S: “Was the dog protecting or defending its own property?” Again, we’re asking that people know a dog’s state of mind. Survey difficulties like this can only be remedied by queries that elicit descriptions of specific behavior, e.g., “was the dog barking at a stranger from within a space where he was confined prior to the victim entering the space?” which might address the underlying assumptions that prompted the inclusion of the factor. But these require complex interviews conducted by skilled interviewers. This moves us into the issues of the next section.
Final difficulty: lack of practical application
In this section, we consider the remaining factor that has not been disqualified with regard to one of the difficulties described above, along with a selection of incident-specific factors (M through X) for which a risk analysis could not be performed.
Factor E, the gender of the dog, totals 69% of the dogs involved in bites resulting in claims to be males. If a risk analysis were to be performed by comparison with a control group of insured dog owners with no claims against them, and the proportion of male to female pet dogs were to be substantially different, this could be defined as a risk factor, a protective factor, or neutral. But what is to be done with such information, in the unlikely event that such a finding could be achieved? Should pet owners be encouraged to adopt only females? That is a ludicrous expectation. There really is no practical use for gender as a risk factor, even if it could be shown to be one.
Factors M through X, circumstances of the incident. Even if these circumstances could be shown to be risk factors, it’s still difficult to see what changes would reduce them. Should dog owners keep their dogs at home at all times, if being off the owner’s property is a risk factor? Should they take steps to prevent trespassers? If so, what steps? Should they keep their dogs inside the house or outside? Should they avoid letting people on their property to commit crimes?
Conclusion
Massachusetts 2020 and 2019 home insurance claims data can be viewed here:
https://bit.ly/3DBQOJh
The data presented in these spreadsheets has none of the qualifications necessary for establishing risk factors. It lacks:
– A control group, the absolute requirement for the performance of risk analysis
– Consistent and transparent data collection methodology
– Clearly defined factors
– Data for which accuracy can be demonstrated
Massachusetts 2020 and 2019 home insurance claims data can be viewed here: