Search
Close this search box.
Search

Medically attended dog bites

How often do dog bites require medical attention?

Sources for this graph[1]
According to the most widely cited studies of dog bites[2] at least 4 out of 5 (80%) of all dog bites cause no injury at all or injuries so minor that no medical treatment was sought, even though the threshold for medical treatment may well be lower for dog bite injuries than for those from other causes.
 
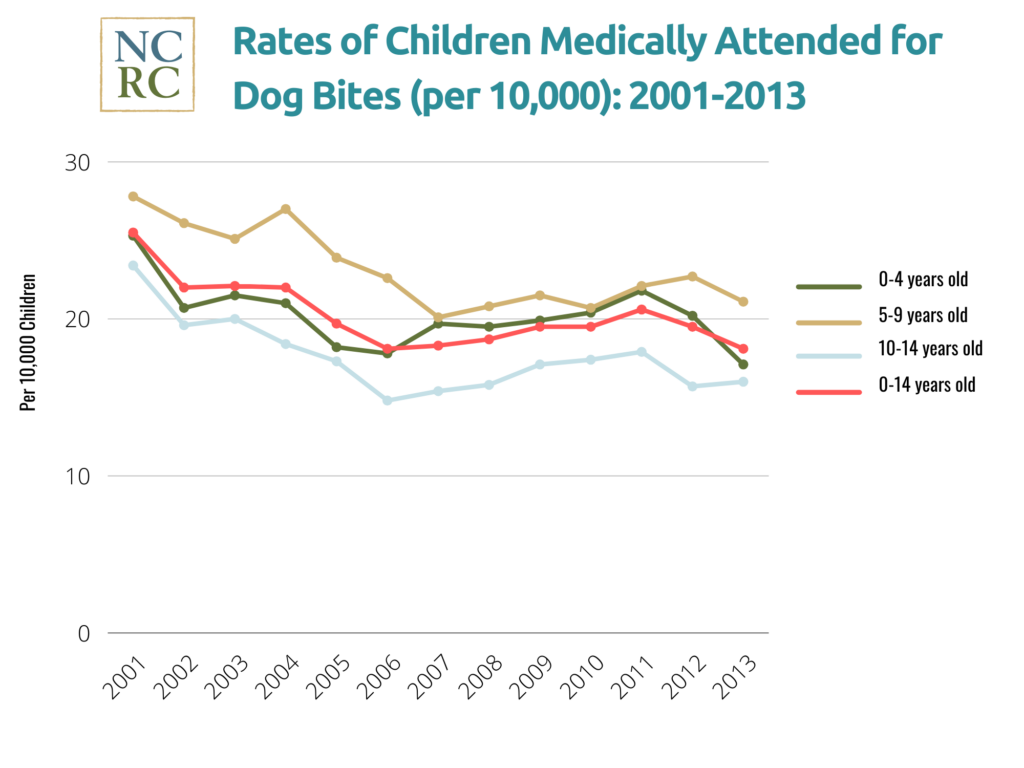
The rate of dog bites sustained by children has been steadily decreasing over the last decade:
Sources for this graph[3]

How severe are these injuries?

Among injuries presented for treatment at Emergency Departments, dog bite injuries are generally much less severe than the typical injury:
  • 96% of dog bite injuries presenting at ER’s are minor[4]– the person is treated and released. Dog bite injuries are among the highest rate of treat and release for any injury tracked by the CDC.
  • Less than 1.5% require hospitalization[5], unlike injuries in general, which result in hospitalization more than 4 times as often.
Severity comparisons with other common injury modalities may be helpful here:
  • Kids 1-12 who go to the ER with an object stuck in an ear, eye, or nose[6] are more than 3 times more likely to be injured seriously enough to be hospitalized than those who present with a dog bite. This does not include objects swallowed or stuck in a child’s throat or airway which are even more serious.
  • Injuries caused by shoes and socks[7] (not counting sports shoes) are almost 4 times more likely to require hospitalization than dog bites.
 

Our Data

To produce comparisons such as those above, and graphics such as the chart on rates of bites to children, we use the Center for Disease Control’s Web-based Injury Statistics Query and Reporting System (WISQARS)[8] for dog bites and  other injury modalities and the Consumer Product Safety Commission[9] for product related injuries, both of which use the National Electronic Injury Surveillance System (NEISS). This provides the most reliable data because NEISS:

  • Collects large samples, gathering data from a nationally representative sample of 100 hospital emergency departments, ranging from large inner-city hospitals with trauma centers to suburban, rural, and children’s hospitals
  • Is based on actual emergency room intake data
  • Provides clear indicators of injury treatment severity
  • Have been consistently replicated each year over a long period
  • Allow for ready access to comparisons by year, age group, gender, and kind of injuries
  • Limitation—NEISS captures injuries treated in hospital emergency departments, not private doctor’s offices or urgent care clinics
We do refer to the most frequently cited studies[10] but only as a source of overall bite incidence, including those that cause no injury. We do not use them as our primary source of bite severity or injurious bite incidence because they:
  • Are based on small sample telephone surveys asking people to remember events over a year’s time
  • Had low respondent rates and wide margins of error
  • Are one time surveys that quickly become dated and are seldom replicated
  • Provide only vague distinctions between injurious and non-injurious bites and vague definitions of injury
Updated February 1, 2016

For comprehensive review of the literature surrounding growling, snarling, snapping, and biting behavior (incidence and correlates) please see National Canine Research Council’s complete analysis here

 SOURCES AND NOTES:
 Slight or No Injury & Treated and Released:
Gilchrist et al., 2008 (see below) was used for the total number of bites, and for the percentage receiving medical treatment, as this (and the predecessor, Sacks et al., 1996) is the only study that has attempted to include non-injurious incidents in dog bite counts. 
Serious:
Centers for Disease Control and Prevention, Web-based Injury Statistics Query and Reporting System (WISQARS), Non-fatal injury reports, 2001-2013. http://webappa.cdc.gov/sasweb/ncipc/nfirates2001.html
Query: Bite: Dog; Disposition: Transferred or Hospitalized; Years: 2001-2003 [Averaged]
Fatalities:
Patronek, G.J., Sacks, J.J., Delise, K.M., Cleary, D.V., & Marder, A.R. (2013). Co-occurrence of potentially preventable factors in 256 dog bite–related fatalities in the United States (2000–2009). Journal of the American Veterinary Medical Association. 248(12), 1726-1736.
2. Sacks J.J., Kresnow, M.J., & Houston, B. (1996). Dog bites: How Big a Problem? Injury Prevention, 2, 52-54.
Gilchrist, J., Sacks, J.J., White, D., & Kresnow, M.J. (2008). Dog Bites: Still a Problem? Injury Prevention, 14(5), 296-301.  
These 2 studies are the source of the frequently cited 4.5 million annual dog bite rate in the United States, and are the result of a telephone survey of all types of injuries sustained by members of 5,238 households in the 1996 study and 9,684 in the study published in 2008. The results include all bites that the respondents could recall during the preceding year, including those that caused no injury.
3. Centers for Disease Control and Prevention, Web-based Injury Statistics Query and Reporting System (WISQARS), Non-fatal injury reports, 2001-2013. http://webappa.cdc.gov/sasweb/ncipc/nfirates2001.html
Query: Bite: Dog; Disposition: All Cases; Years: 2001-2013 [Separate query each year]; Age Group: 0-4
Query: Bite: Dog; Disposition: All Cases; Years: 2001-2013 [Separate query each year]; Age Group: 5-9
Query: Bite: Dog; Disposition: All Cases; Years: 2001-2013 [Separate query each year]; Age Group: 10-14
Query: Bite: Dog; Disposition: All Cases; Years: 2001-2013 [Separate query each year]; Age Group: 1-12
All rates converted from 100,000 to 10,000.
4. Centers for Disease Control and Prevention, Web-based Injury Statistics Query and Reporting System (WISQARS), Non-fatal injury reports, 2001-2013. http://webappa.cdc.gov/sasweb/ncipc/nfirates2001.html
Query: Bite: Dog; Disposition: Treated and Released; Years: 2001-2012
5. Centers for Disease Control and Prevention, Web-based Injury Statistics Query and Reporting System (WISQARS), Non-fatal injury reports, 2001-2013. http://webappa.cdc.gov/sasweb/ncipc/nfirates2001.html
Query: Bite: Dog; Disposition: All Cases; Years: 2001-2012.
Query: Bite: Dog; Disposition: Hospitalized; Years 2001-2012.
6. Centers for Disease Control and Prevention, Web-based Injury Statistics Query and Reporting System (WISQARS), Non-fatal injury reports, 2001-2013. http://webappa.cdc.gov/sasweb/ncipc/nfirates2001.html
Query: Foreign Body; Disposition: Hospitalized; Years: 2001-2012; Custom Age Range: 1-12.
Query: Bite: Dog; Disposition: Hospitalized; Years: 2001-2012; Custom Age Range: 1-12.
7. US Consumer Product Safety Commission (CPSC) NEISS estimates query builder,  https://www.cpsc.gov/cgibin/NEISSQuery/home.aspx
Query: Code 1645 (daywear socks); Year: 2012
Query: Code 1615 (non-athletic shoes) ; Year: 2012
8. This system collects data from a large sample of emergency departments, in a standardized methodology since 2000 ensuring valid comparisons from year to year. See http://www.cdc.gov/injury/wisqars/facts.html for an explanation of how this data is collected and compiled.
9. This system collects data from a large sample of emergency departments, in a standardized methodology since 2000 ensuring valid comparisons from year to year. See http://www.cpsc.gov/en/Research–Statistics/NEISS-Injury-Data/ for an explanation of how this data is collected and compiled.
10. Sacks J.J., Kresnow, M.J., & Houston, B. (1996).  Dog bites: How Big a Problem? Injury Prevention, 2, 52-54.
Gilchrist J., Sacks J.J., White, D., & Kresnow, M.J. (2008). Dog Bites: Still a Problem? Injury Prevention, 14(5), 296-301.